The Kill Bill team loves data and measuring things. As part of our performance work last year, we did a pass at cleaning up all of our metrics. As a result, we now export over 600 metrics all over the stack, from latency of low-level database queries to overall rates of HTTP requests. These can be easily integrated with InfluxDB and Grafana: that’s how Groupon monitors its payment infrastructure.
Maintaining a monitoring system is no easy task however, especially at scale. It’s no surprise that even companies like Stripe are outsourcing (some of) this work to Datadog. In this post, I’ll show you how to export Kill Bill metrics with Datadog’s standard agent, and some of the metrics you want to keep an eye on in production.
I assume you already have Kill Bill running using our Docker image and that you have a Datadog API key.
The first step is to enable JMX, by adding the following System Properties to your kpm.yml:
~ > docker exec -ti killbill /bin/bash
tomcat7@docker:/var/lib/tomcat7$ export TERM=xterm
tomcat7@docker:/var/lib/tomcat7$ vi /etc/killbill/kpm.yml
# Add the following to the jvm: line
#  -Dcom.sun.management.jmxremote=true
#  -Dcom.sun.management.jmxremote.authenticate=false
#  -Dcom.sun.management.jmxremote.port=8000
#  -Dcom.sun.management.jmxremote.ssl=false
tomcat7@docker:/var/lib/tomcat7$ exit
~ > docker restart killbill
Then, install the Ubuntu Datadog agent (when prompted, the sudo password is tomcat7):
~ > docker exec -ti killbill /bin/bash
tomcat7@docker:/var/lib/tomcat7$ cd /var/tmp
tomcat7@docker:/var/lib/tomcat7$ DD_API_KEY=REPLACE_ME bash -c "$(curl -L https://raw.githubusercontent.com/DataDog/dd-agent/master/packaging/datadog-agent/source/install_agent.sh)"
tomcat7@docker:/var/lib/tomcat7$ sudo /etc/init.d/datadog-agent start
Note that the final installation step, when the agent tries to register with your account, may fail. Starting the agent manually afterwards fixes the issue.
Go now to you Datadog account and enable the JMX integration.
The final step is to configure the metrics to send. Here is a handy script to generate a configuration file monitoring most of the exported metrics (place the file at /etc/dd-agent/conf.d/jmx.yaml):
You most likely don’t want to send all of them though: not only does Datadog limit you to 350 metrics, but also not all of them are pertinent to your workload.
When we help a company run Kill Bill in production, we typically focus on the following metrics:
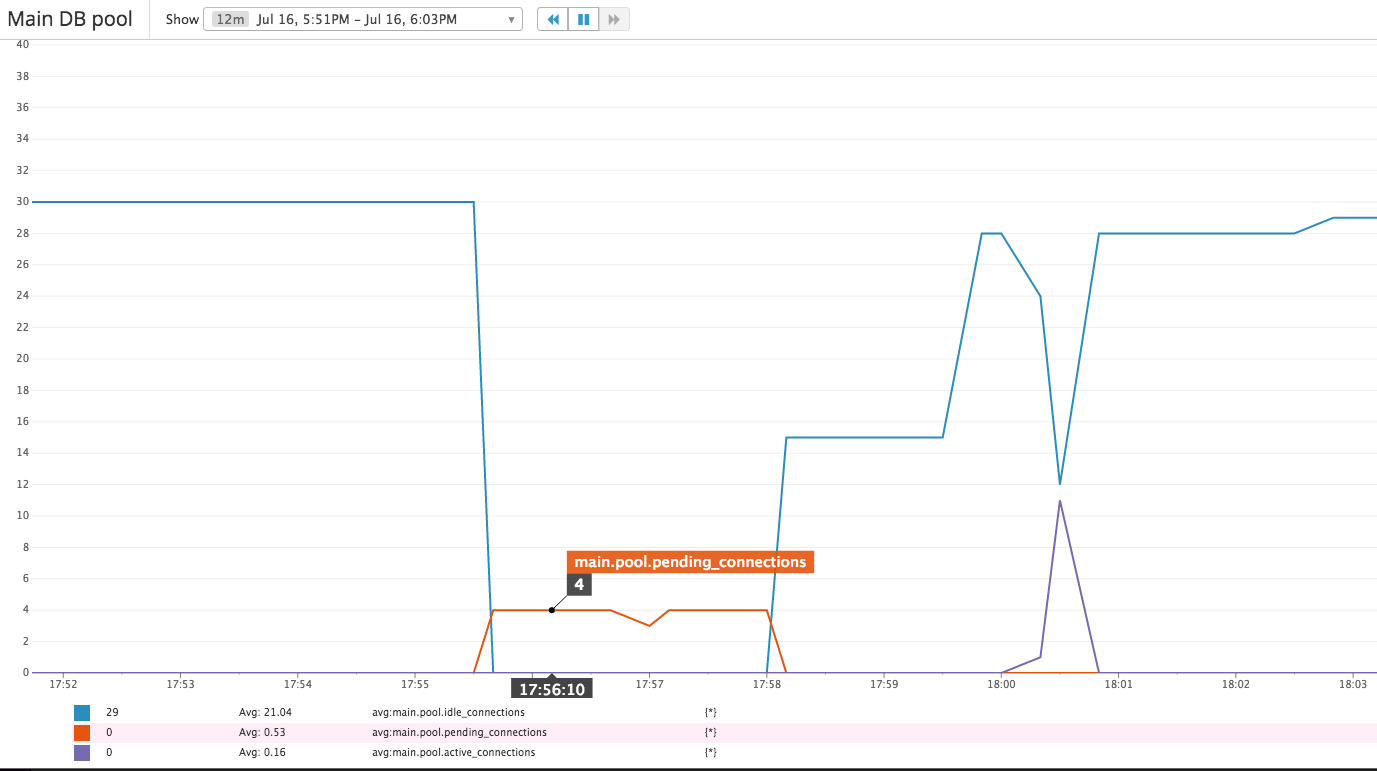
- Database connection pool(s): does Kill Bill have enough threads configured? Do they take a long time coming back to the pool(s)? While Kill Bill scales horizontally, a badly configured database could become a bottleneck
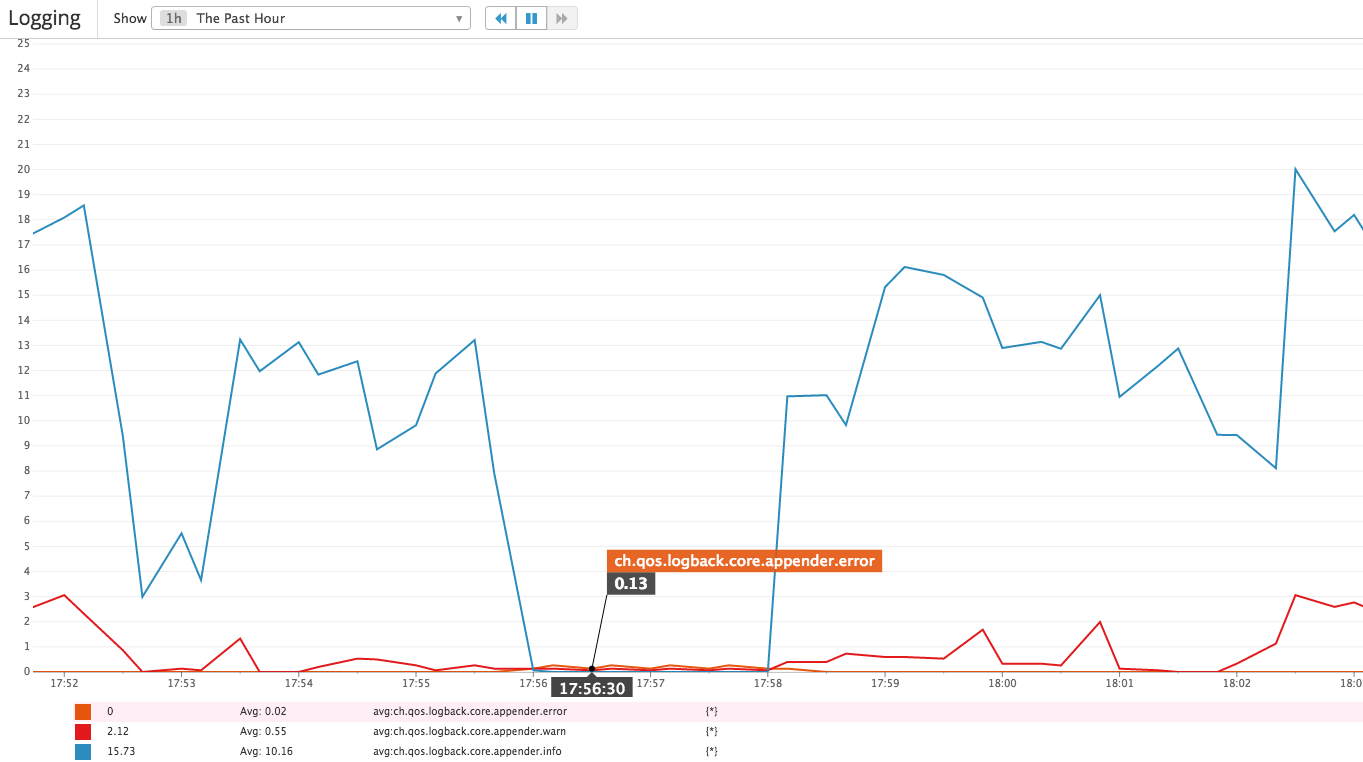
- Logging: what is the relative rate of INFO, WARN and ERROR events? These can be a good proxy of the overall health of the system
- Payments latency: how long do API calls to the gateways take? In several occasions, we were able to discover outages before being notified by the gateway itself
- HTTP response codes: what is the rate of API calls made by the clients, per endpoint and response code?
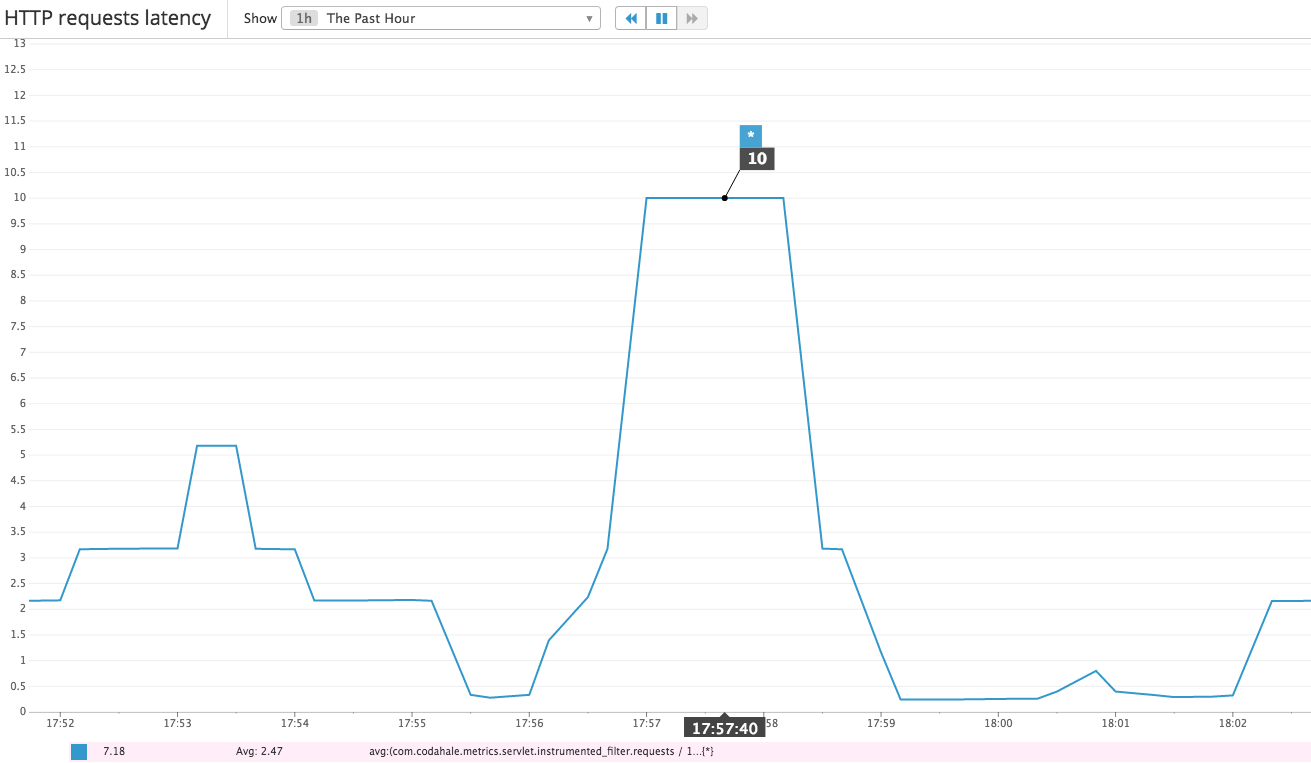
As an example, here are some of the graphs generated during a database outage:
The right metrics depend on your workload. Once you have the basic pipeline setup, look at all the metrics generated by Kill Bill by going to http://127.0.0.1:8080/1.0/metrics?pretty=true and build dashboards based on the most pertinent ones. As usual, we’re here to help if you have any questions!


